- At each project-related meeting, members assess:
- Meeting Promoter Score (MPS) (peer assessed quality of each member’s participation)
- Relationship quality between project members is inferred by the average of their reciprocal MPS
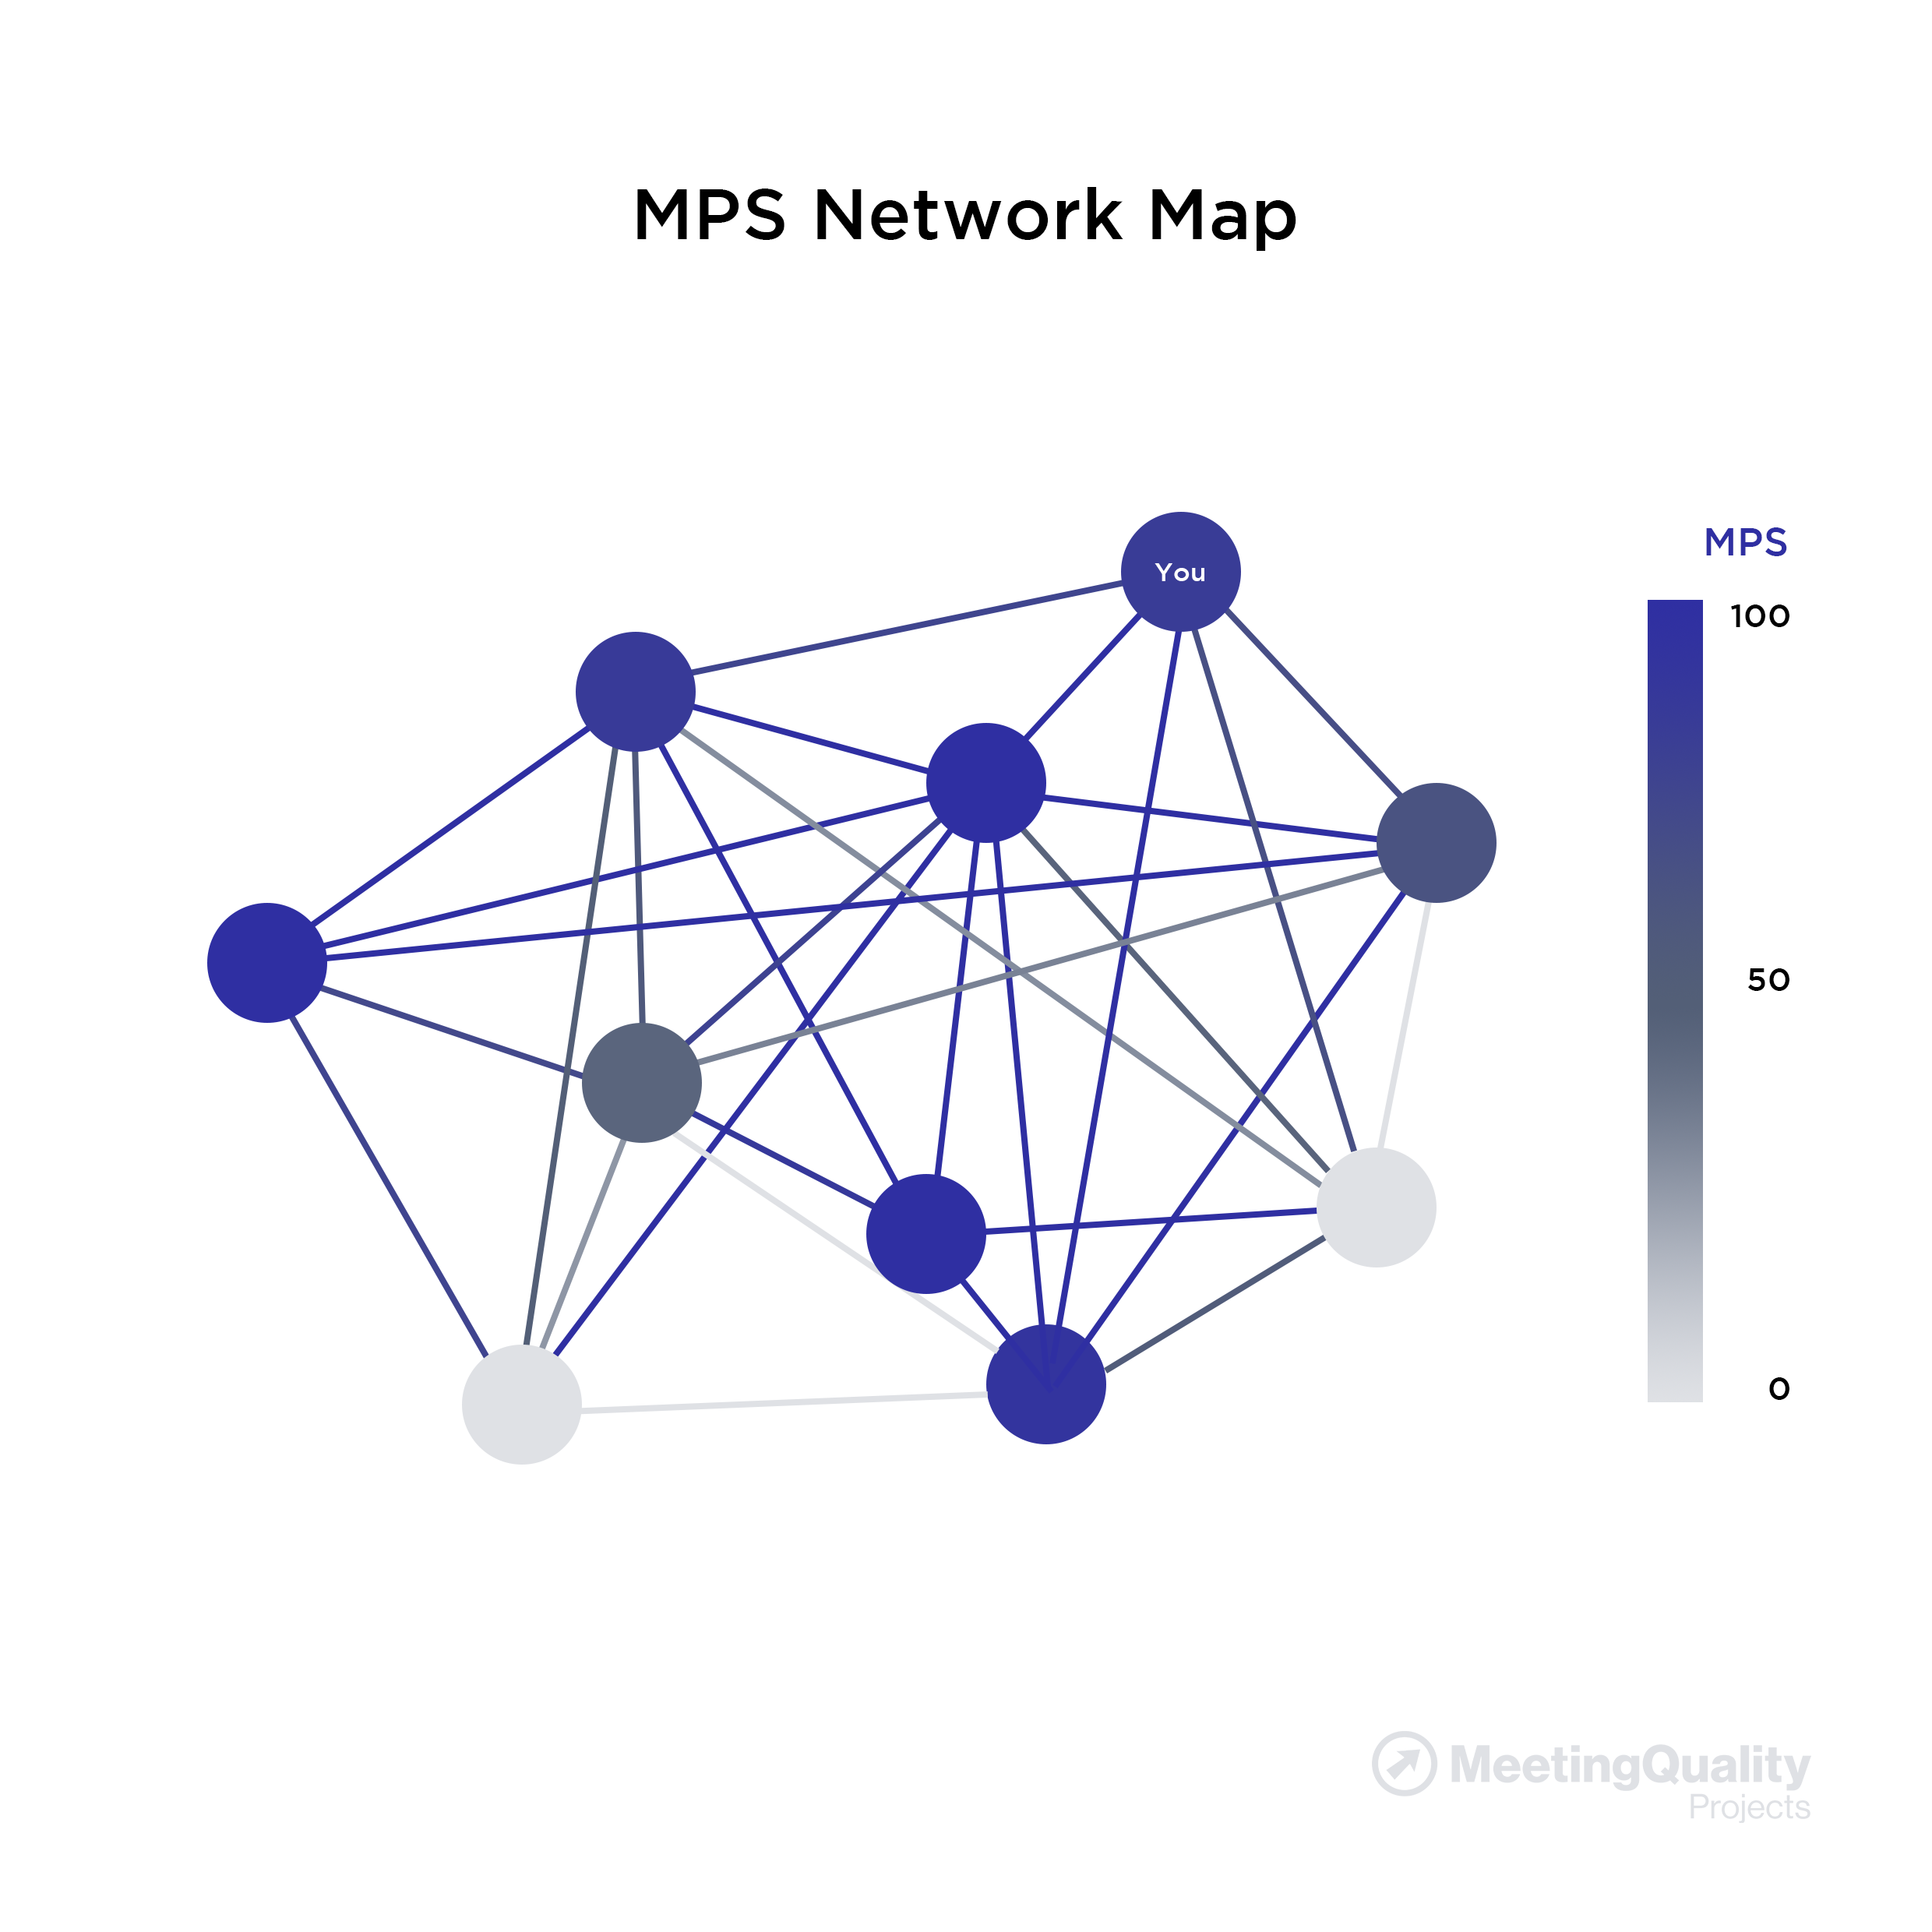
- The scale on the Network Relationship Map (above) denotes the quality of the MPS and quality of relationships (as assessed by peers), and ranges from dark blue (very good) to light grey (very poor)
- The shapes in the map represent member types:
- circles = project team
- triangles = steering committee
- diamonds = stakeholders
- The color of a shape represents the quality of the MPS (aggregated over time)
- The color of the connecting lines represents the relationship quality (on the project) between any two members (aggregated over time)
- The Network Relationship Map (above) shows:
- two members contributing somewhat negatively
(light grey shapes)
- weak and poor relationships between several members (light grey connecting lines)
|