MeetingQuality Project Success Family: Stakeholder Group Meeting Use Case |
|||
Use Case: How MeetingQuality is deployed within a Stakeholder Group |
|||
This page illustrates the steps that Stakeholder Groups (those having interest, power, influence, expectations, etc. in a project’s outcome) would follow from issuing meeting invitations, to receiving and submitting the assessments, to receiving and utilizing the metrics and reports. |
|||
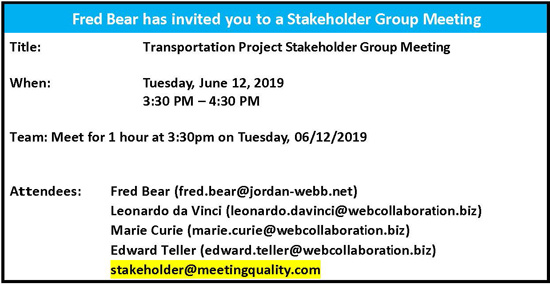
1. Stakeholder group adds one additional email address to the group's meeting invitation (stakeholder@meetingquality.com) |
2. As meeting begins, Stakeholder Group members receive an
|
||
 |
 |
||
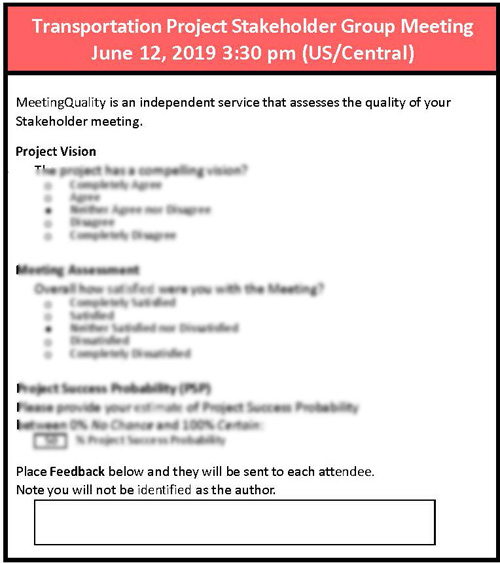
3. When meeting ends, attendees complete their meeting assessments (taking 45 seconds or less) |
4. MeetingQuality’s secure server aggregates the results using proprietary and Social Network Analysis algorithms and applies Artificial Intelligence (IBM Watson) to the action items |
||
 |
 |
||
5. 24 hours after meeting ends, Stakeholders are emailed these metrics / reports… |
|||
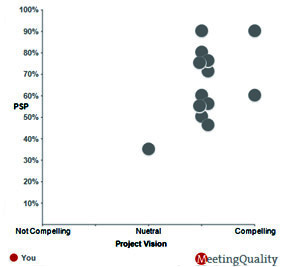
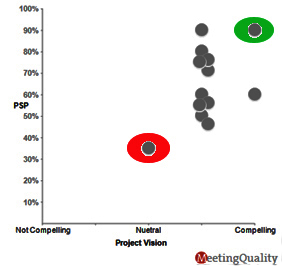
Individual Scores (Project Success Probability (PSP) versus Project Vision) |
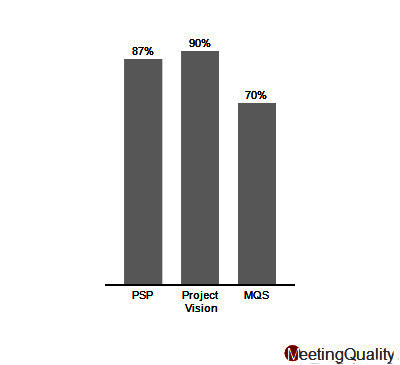
Comparative History Project Success Probability (PSP) vs. Vision vs. MeetingQuality Score (MQS) |
Action Items / Feedback (reported anonymously) (author name un-traceable) |
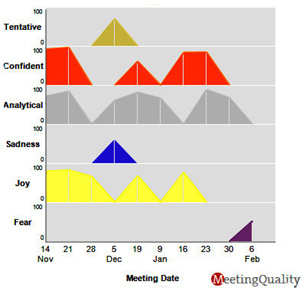
Analysis of Action Items / Feedback over time using Artificial Intelligence (IBM Watson) |
 |
 |
|
 |
 |
6. Stakeholders incorporate the discussion & review of metrics and reports into periodic Stakeholder meetings as part of the change management methodology used. MeetingQuality Consulting Partners provide management advisory services by interpreting the results and turning them into real-world solutions… |
||
7. Periodically, Stakeholders are emailed other metrics / reports – such as… |
|||
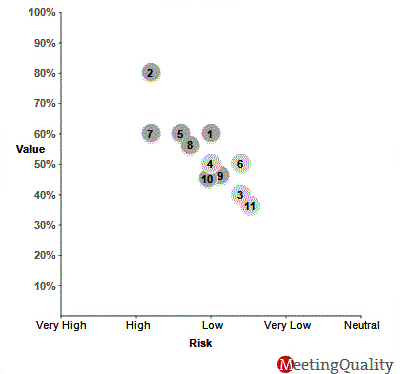
Risk vs. Value – X-Y Plot |
Project with above-average PSP and Vision at Project Start-Up |
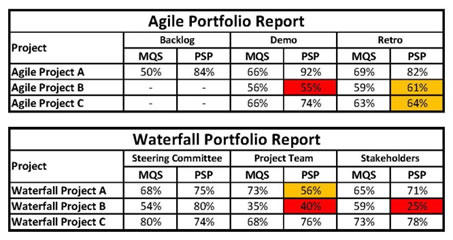
Portfolio Reports |
|
Stakeholders may select from a broad range of factors to assess risk versus value. For example, an assessment of Organization Capability may reveal that project risk is higher than the calculated risk of a traditional Risk-Value analysis. |
Stakeholder [green ellipse] sees compelling Vision with a high PSP (90%). Stakeholder [red ellipse] sees neutral Vision with a low PSP (35%). Other Stakeholders see a more compelling Vision with varying |
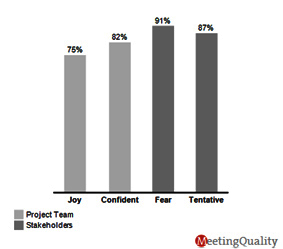
Artificial Intelligence (IBM Watson) analysis of Action Items / Comments in bar graph shows Project Team [light grey bars] as confident and joyful while Stakeholders [dark grey bars] are tentative and fearful |
Portfolio Reports track performance across multiple programs and portfolios. The red cells for Waterfall Project B indicate that the project team and stakeholders both feel this project is unlikely to succeed. Meanwhile steering committee members believe that Project B will succeed. This is the classic profile of an over optimistic project manager |
 |
 |
 |
 |